Water depth during extreme rainfall mapped down to paving-stone level |
|
|
|
|
 |
| 89 sec |
New maps reveal risk of flooding from heavy rainfall
Extreme rainfall is increasingly causing problems in public spaces. New nationwide water-depth maps show where water may remain on streets and how deep it could become. The maps give municipalities and other parties greater insight into where measures are needed.
| Image via: Dutch Green Building Council (DGBC) |
Cities and towns are increasingly experiencing short, intense rainstorms. The Dutch Green Building Council (DGBC) has therefore developed new nationwide water-depth maps. The maps show how much water could accumulate on streets during extreme rainfall.
The maps were presented to Jeroen Haan, chair of the Dutch Water Authorities. According to Haan, the maps will help improve preparedness for the consequences of climate change. 'The weather is becoming more extreme, with both drier and wetter conditions. This can lead to considerable damage and even casualties. The water-depth maps show where flooding from heavy rainfall may occur and where problems could arise.'
|
|
Potential water depths mapped almost down to individual paving stones
| |
|
From climate risk to practical information
The maps show expected water depths for three extreme rainfall scenarios: 70 millimetres of rain in one hour, 90 millimetres in one hour and 155 millimetres in two hours. The data is based on up-to-date elevation data for the Netherlands and the latest climate scenarios from the KNMI, the Royal Netherlands Meteorological Institute.
The maps have a resolution of 50 by 50 centimetres. According to DGBC, this makes it possible to see almost down to individual paving stones how much water could accumulate at a particular location. This makes the maps useful for municipalities, housing associations, property companies and public space managers, among others.
Jan Kadijk, manager of knowledge & innovation at DGBC, emphasises that the maps are primarily a tool. 'Short, extreme rainstorms pose a growing risk to the built environment. With these water-depth maps, we can now see almost down to individual paving stones the water depths that may occur.'
According to Kadijk, it remains necessary to assess the vulnerability of buildings and areas locally. Factors such as the height of an entrance, the design of public spaces and rainwater drainage all play an important role.
|
|
Knowing where water accumulates helps make better decisions
| |
|
Maps available via the Climate Impact Atlas
The new maps are freely accessible via the Climate Impact Atlas. They can also be used within the Framework for Climate Adaptive Buildings (FCAB), a DGBC method that enables organisations to map climate risks such as heat, drought, flooding from heavy rainfall and floods.
The maps can help municipalities and landscaping contractors determine appropriate measures in public spaces. Examples include street design, water storage, green infrastructure and climate-adaptive projects.
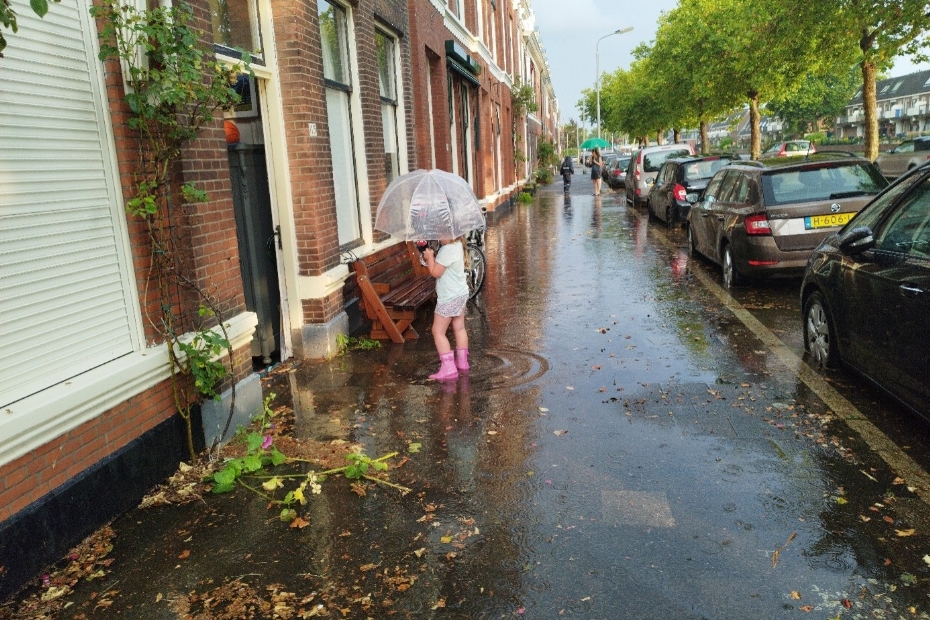 | | Image via: Dutch Green Building Council (DGBC) |
|
|
This article was previously published on 11 September 2026 on the website of Stad + Groen.
| LOG IN
with your email address to respond.
|
|
|
| There are no comments yet. |
|
| |
Anyone can place small ads for free through their own account.
Place a free ad
|
|
|
|





